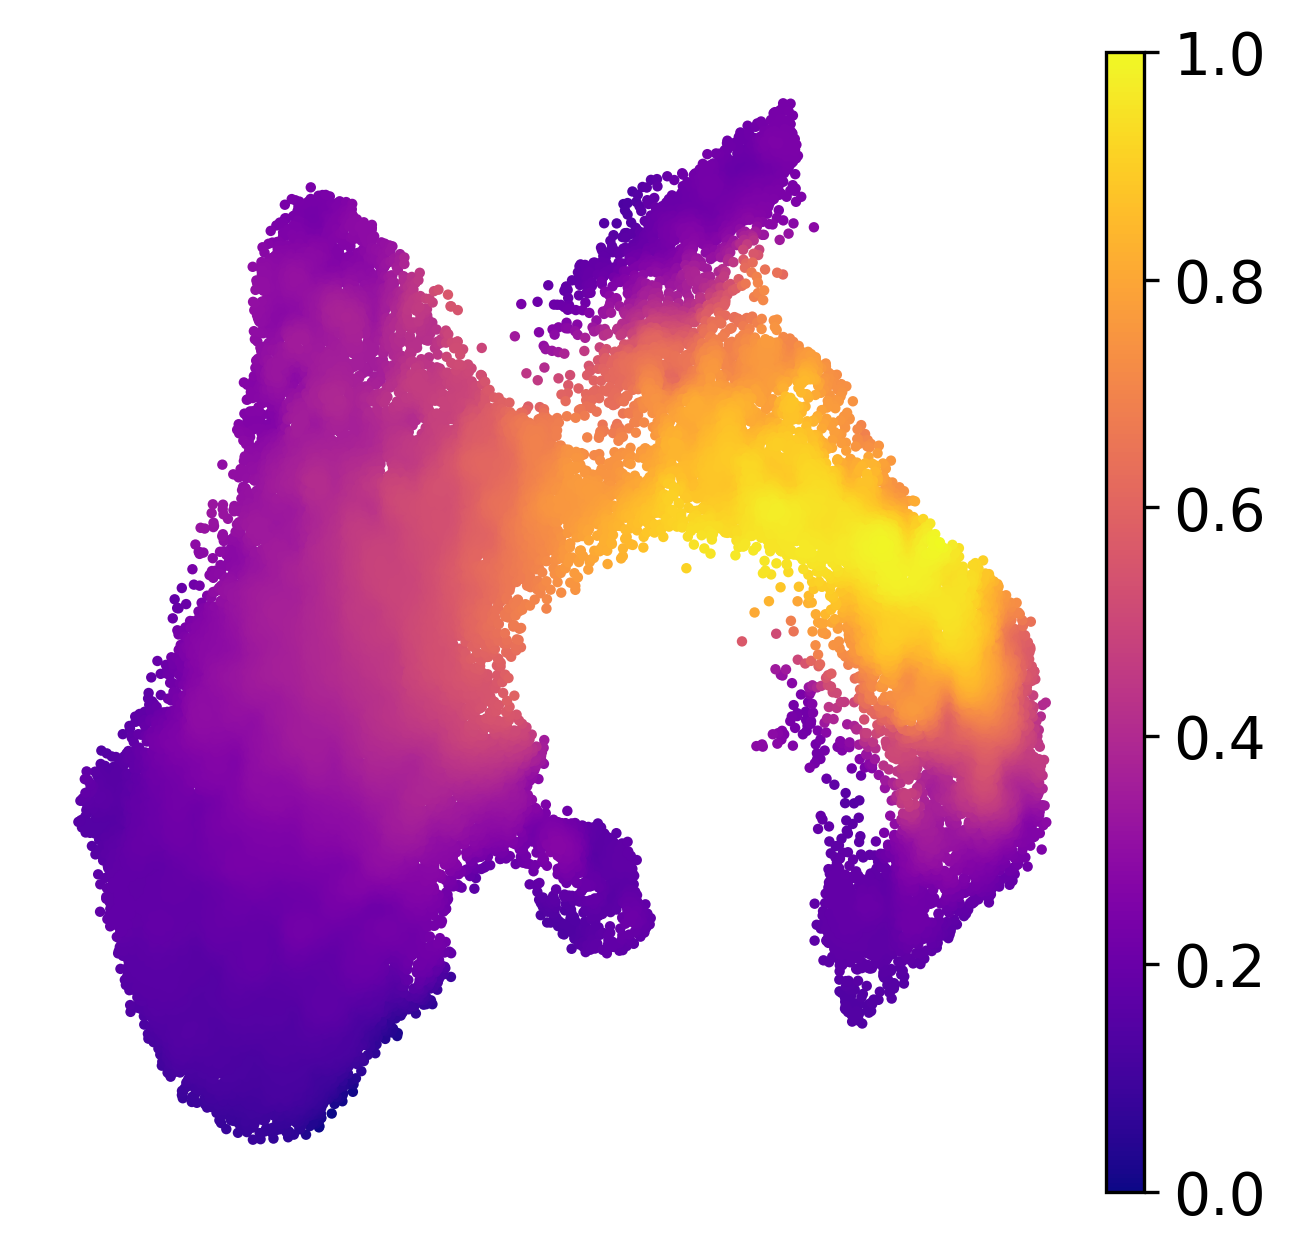
Application1 of scRL on AML dataset
[1]:
import scanpy as sc
sc.set_figure_params(dpi=150,fontsize=14,figsize=(5,5))

import warnings
warnings.filterwarnings('ignore')
[2]:
adata = sc.read_h5ad('F5_AML.h5ad')
Branch identification
[3]:
sc.pl.umap(adata, color='leiden',s=25,legend_loc=None, frameon=False,title='')

[4]:
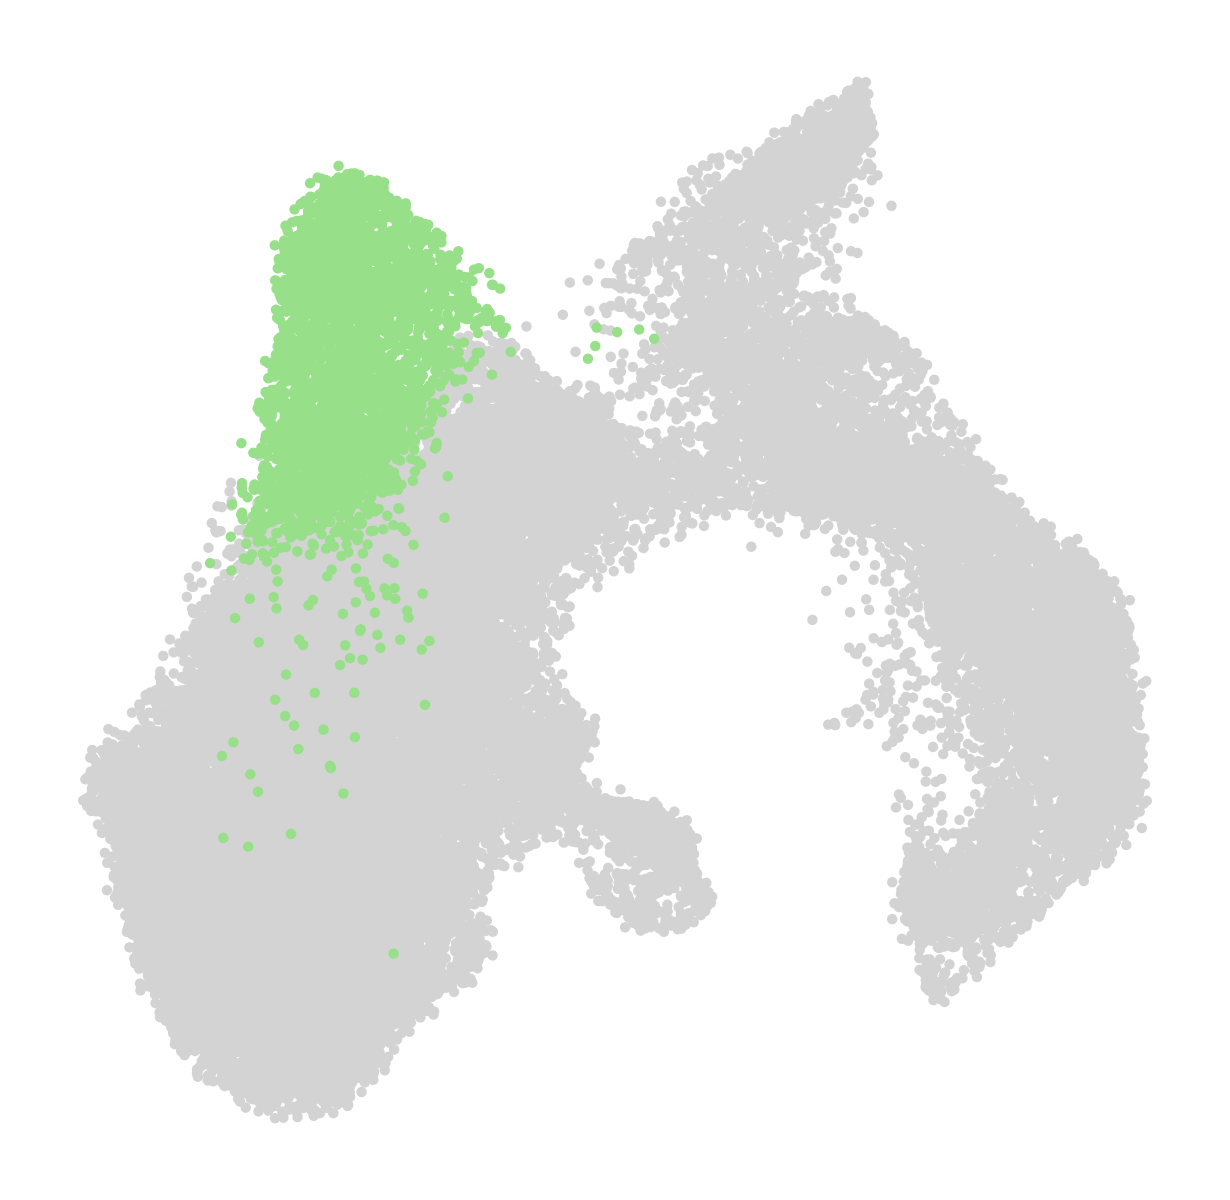
sc.pl.umap(adata, color='leiden', groups=['5'],title='',s=25,frameon=False,legend_loc=None,show=False)
[4]:
<AxesSubplot: xlabel='UMAP1', ylabel='UMAP2'>
[5]:
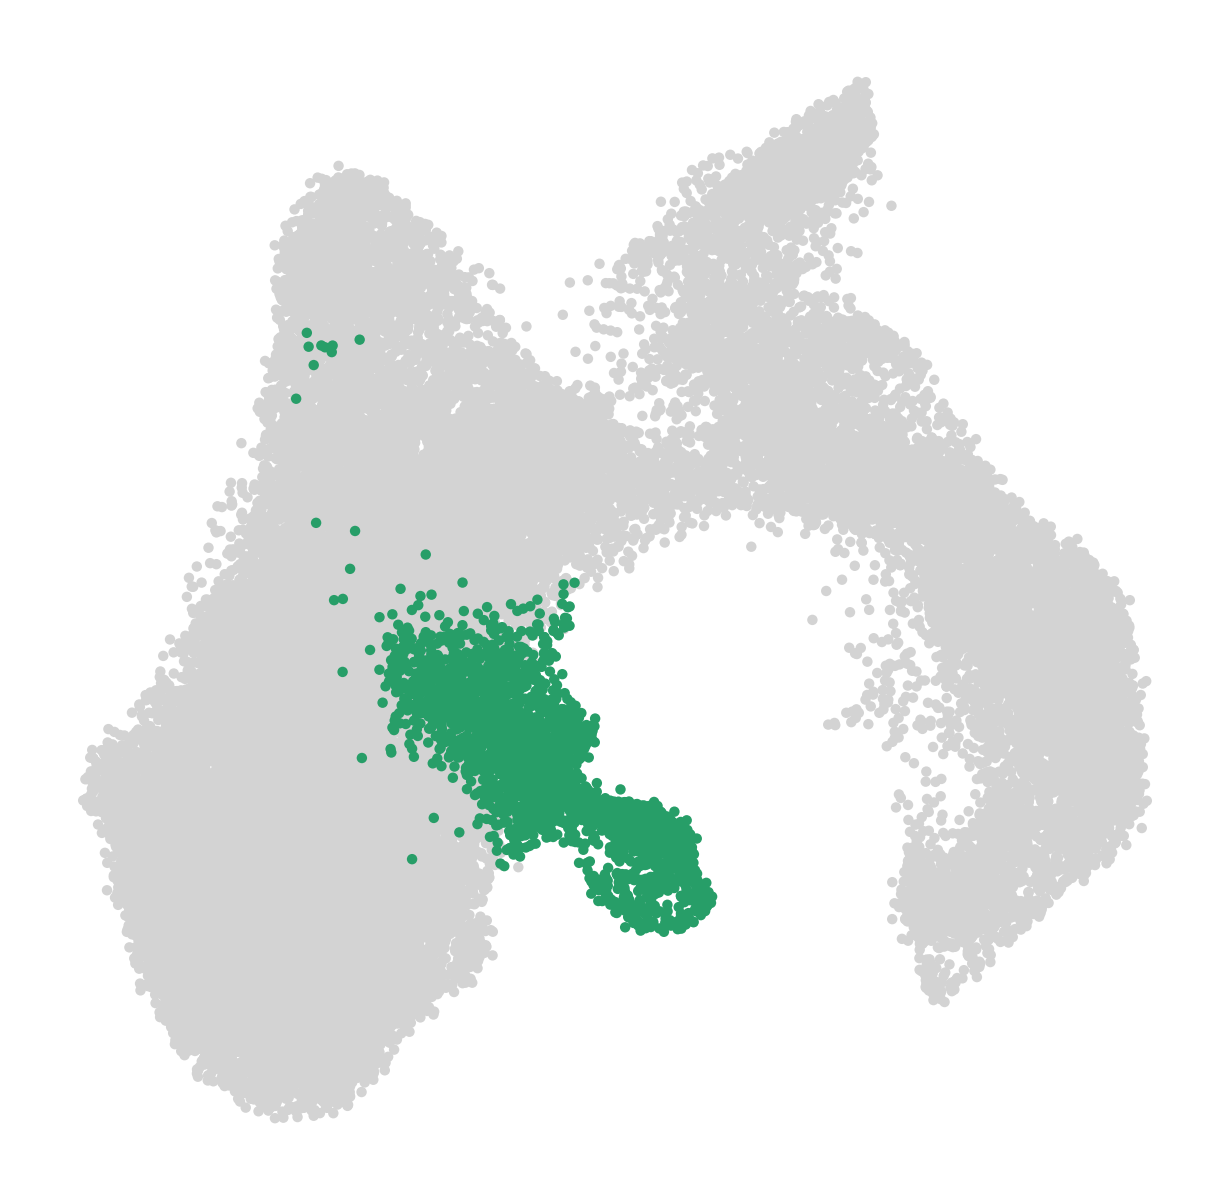
sc.pl.umap(adata, color='leiden', groups=['8'],title='',s=25,frameon=False,legend_loc=None,show=False)
[5]:
<AxesSubplot: xlabel='UMAP1', ylabel='UMAP2'>
[6]:
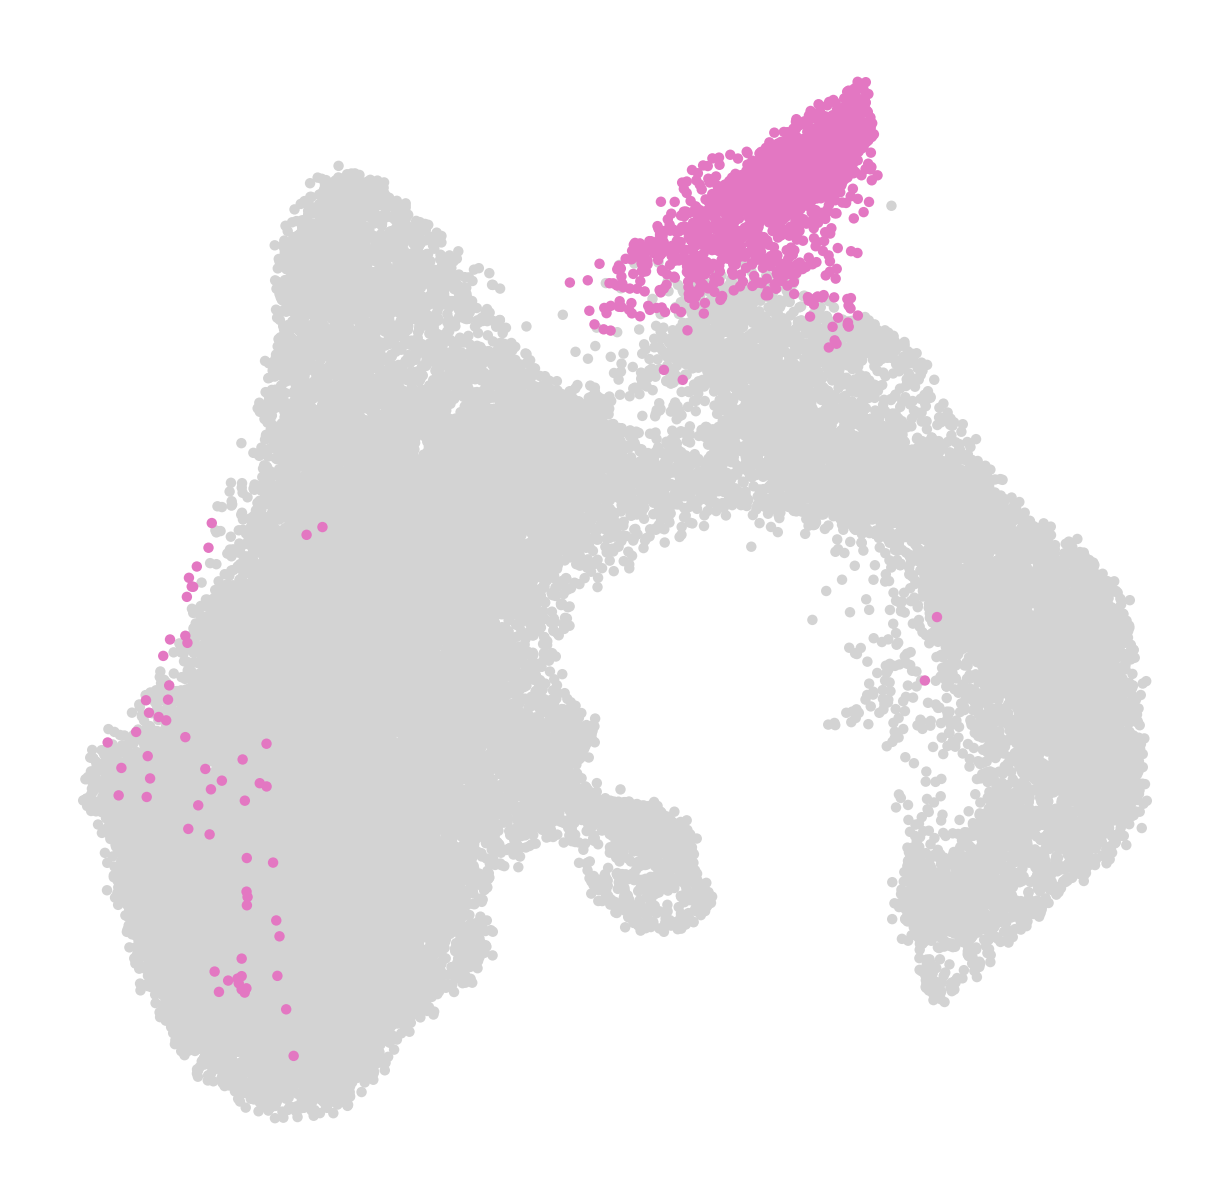
sc.pl.umap(adata, color='leiden', groups=['10'],title='',s=25,frameon=False,legend_loc=None,show=False)
[6]:
<AxesSubplot: xlabel='UMAP1', ylabel='UMAP2'>
[7]:
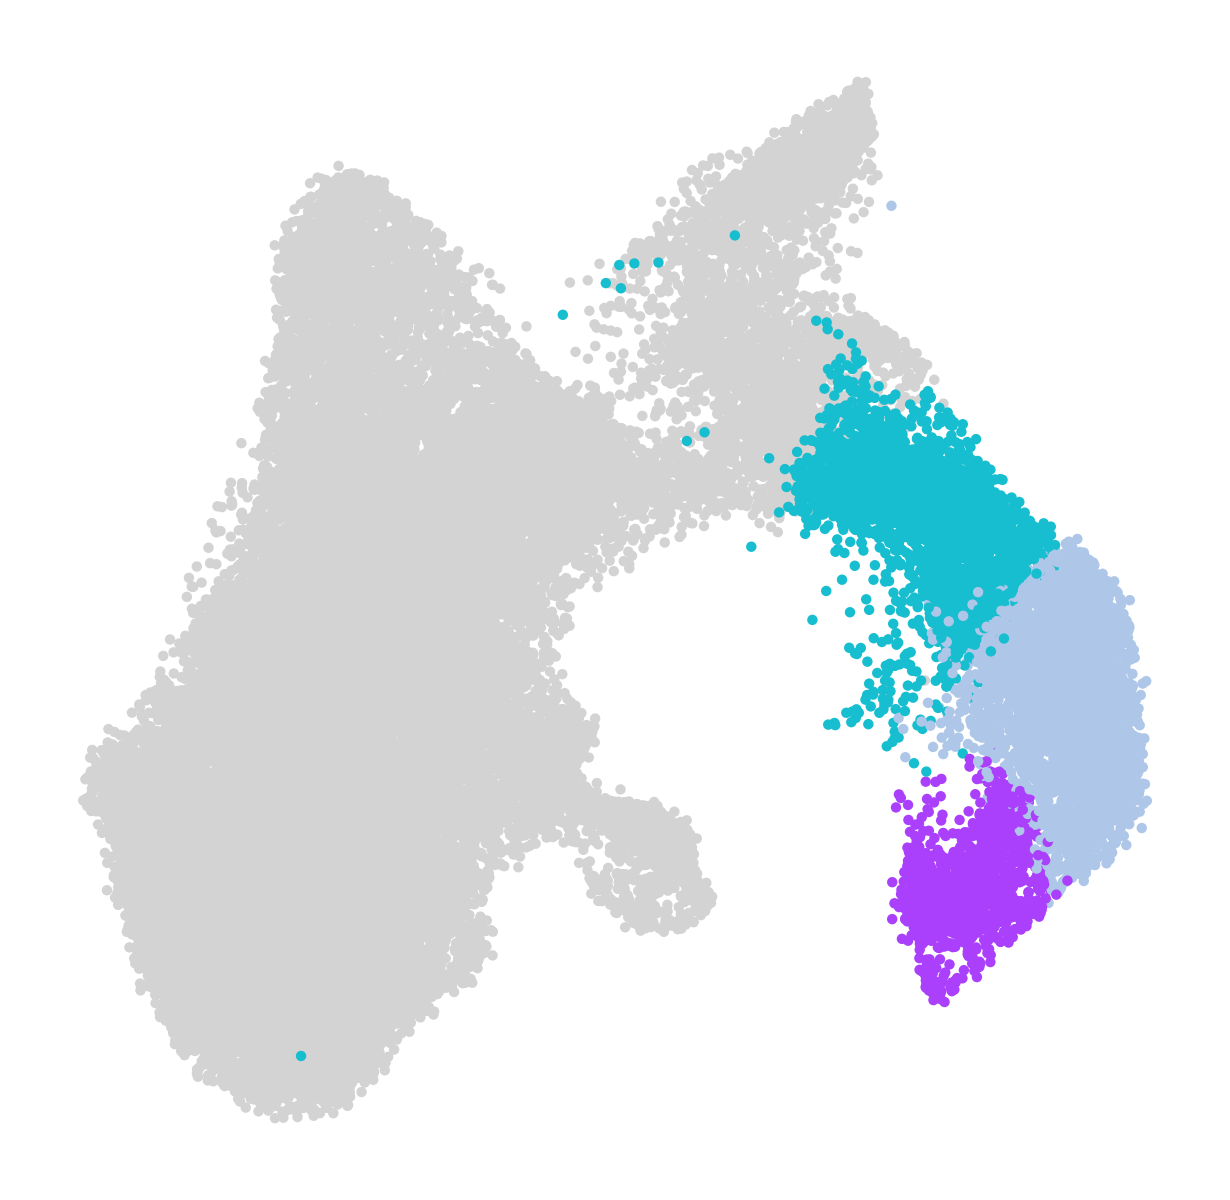
sc.pl.umap(adata, color='leiden', groups=['6','7','11'],title='',s=25,frameon=False,legend_loc=None,show=False)
[7]:
<AxesSubplot: xlabel='UMAP1', ylabel='UMAP2'>
[8]:
lut = dict(zip(adata.obs['leiden'].cat.categories, adata.uns['leiden_colors']))
Pre-setting information for scRL
[9]:
X = adata.obsm['X_umap']
X_pca = adata.obsm['X_pca']
clusters = adata.obs['leiden']
cluster_colors = adata.uns['leiden_colors']
[10]:
import scRL
[11]:
gres = scRL.grids_from_embedding(X, j=8)
scRL.project_cluster(gres, clusters, cluster_colors)
scRL.align_pseudotime(gres, '3')
scRL.project_back(gres, 'pseudotime')
Boundary generating: 100%|███████████████████| 196/196 [00:01<00:00, 100.90it/s]
Mask testing: 100%|█████████████████████████████| 28/28 [00:03<00:00,  7.08it/s]
Adjacent generating: 100%|████████████████| 1515/1515 [00:00<00:00, 2522.17it/s]
Boundary pruning: 100%|████████████████████| 269/269 [00:00<00:00, 12994.14it/s]
Adjacent generating: 100%|████████████████| 1551/1551 [00:00<00:00, 2334.30it/s]
Time used for mapping grids: 13.67 seconds
Time used for projecting annotation : 2.53 seconds
Time used for aligning pseudo-time : 0.60 seconds
[12]:
adata.obs['time'] = gres.embedding['pseudotime']
[13]:
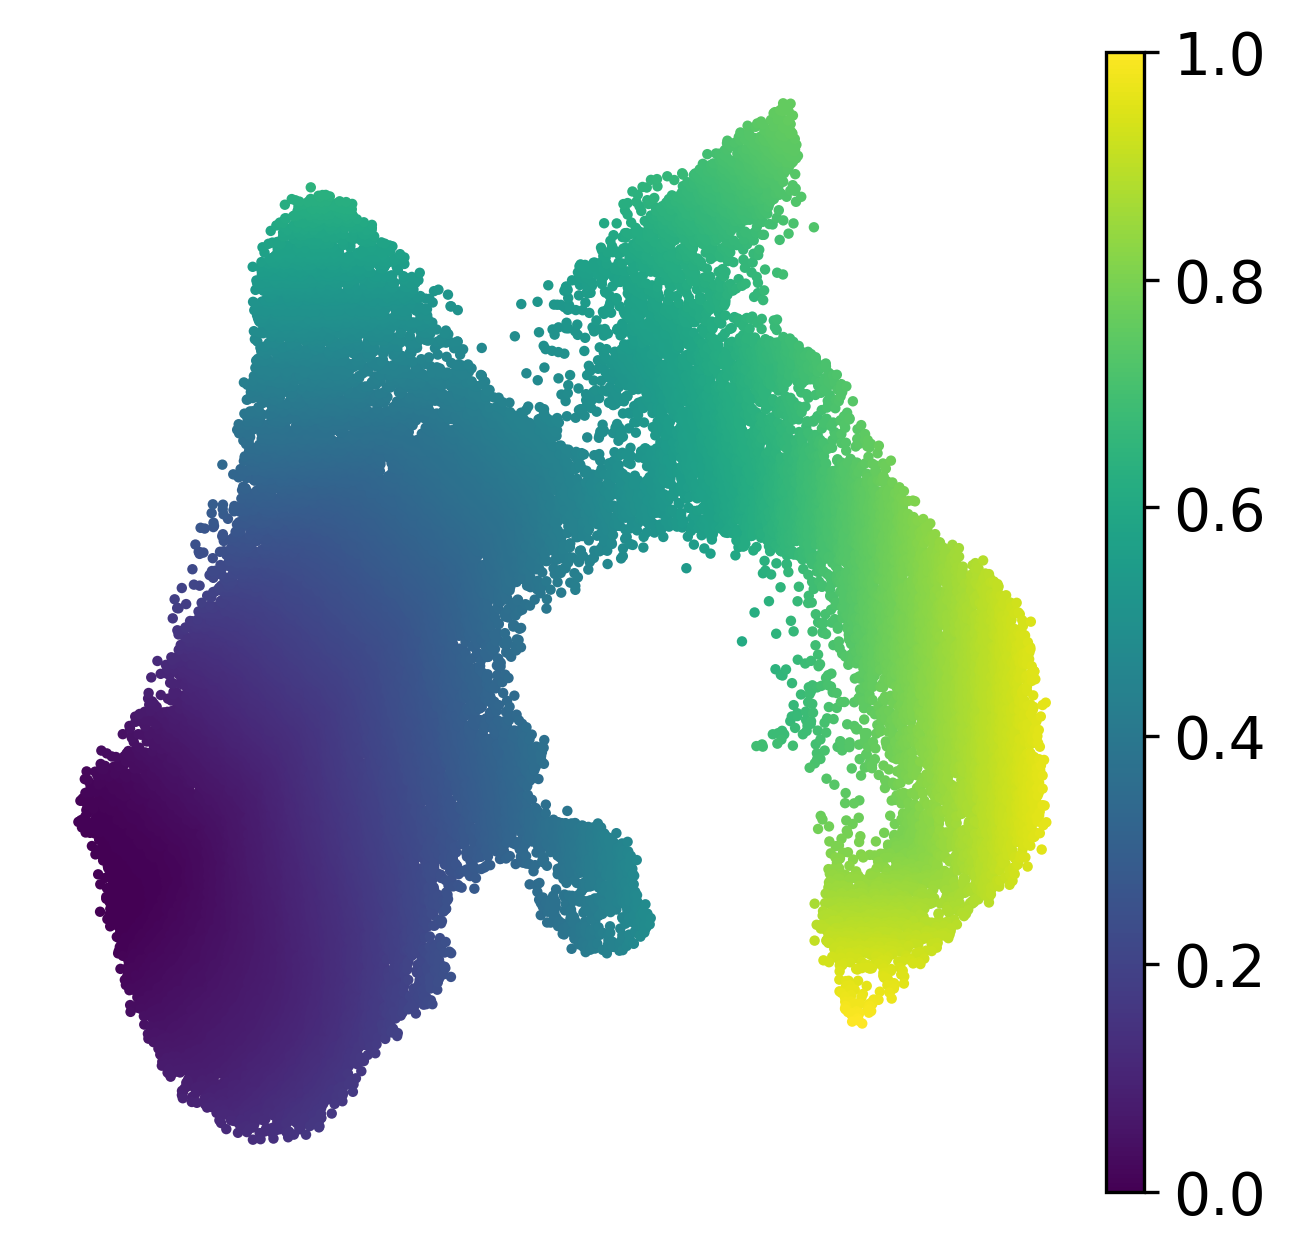
sc.pl.umap(adata, color='time',title='',s=25,frameon=False,show=False)
[13]:
<AxesSubplot: xlabel='UMAP1', ylabel='UMAP2'>
[14]:
del adata.uns['log1p']
[15]:
adata.obs['branch'] = 'Trunk'
adata.obs['branch'][adata.obs['leiden'].isin(['5'])] = 'Bra1'
adata.obs['branch'][adata.obs['leiden'].isin(['8'])] = 'Bra2'
adata.obs['branch'][adata.obs['leiden'].isin(['10'])] = 'Bra3'
adata.obs['branch'][adata.obs['leiden'].isin(['6','7','9','11'])] = 'Bra4'
[16]:
sc.tl.rank_genes_groups(adata, groupby='branch', pts=True)
WARNING: Default of the method has been changed to 't-test' from 't-test_overestim_var'
[17]:
rnk1 = sc.get.rank_genes_groups_df(adata, group='Bra1').sort_values('logfoldchanges', ascending=False)

rnk1['diff'] = rnk1['pct_nz_group'] - rnk1['pct_nz_reference']

gs1 = rnk1[(rnk1['pct_nz_group'] > .25)&(rnk1['pct_nz_reference']<.25)&(rnk1['diff']>.25)].head(10)['names'].tolist()


rnk2 = sc.get.rank_genes_groups_df(adata, group='Bra2').sort_values('logfoldchanges', ascending=False)

rnk2['diff'] = rnk2['pct_nz_group'] - rnk2['pct_nz_reference']

gs2 = rnk2[(rnk2['pct_nz_group'] > .25)&(rnk2['pct_nz_reference']<.25)&(rnk2['diff']>.25)].head(10)['names'].tolist()


rnk3 = sc.get.rank_genes_groups_df(adata, group='Bra3').sort_values('logfoldchanges', ascending=False)

rnk3['diff'] = rnk3['pct_nz_group'] - rnk3['pct_nz_reference']

gs3 = rnk3[(rnk3['pct_nz_group'] > .25)&(rnk3['pct_nz_reference']<.25)&(rnk3['diff']>.25)].head(10)['names'].tolist()


rnk4 = sc.get.rank_genes_groups_df(adata, group='Bra4').sort_values('logfoldchanges', ascending=False)

rnk4['diff'] = rnk4['pct_nz_group'] - rnk4['pct_nz_reference']

gs4 = rnk4[(rnk4['pct_nz_group'] > .25)&(rnk4['pct_nz_reference']<.25)&(rnk4['diff']>.25)].head(10)['names'].tolist()
[18]:
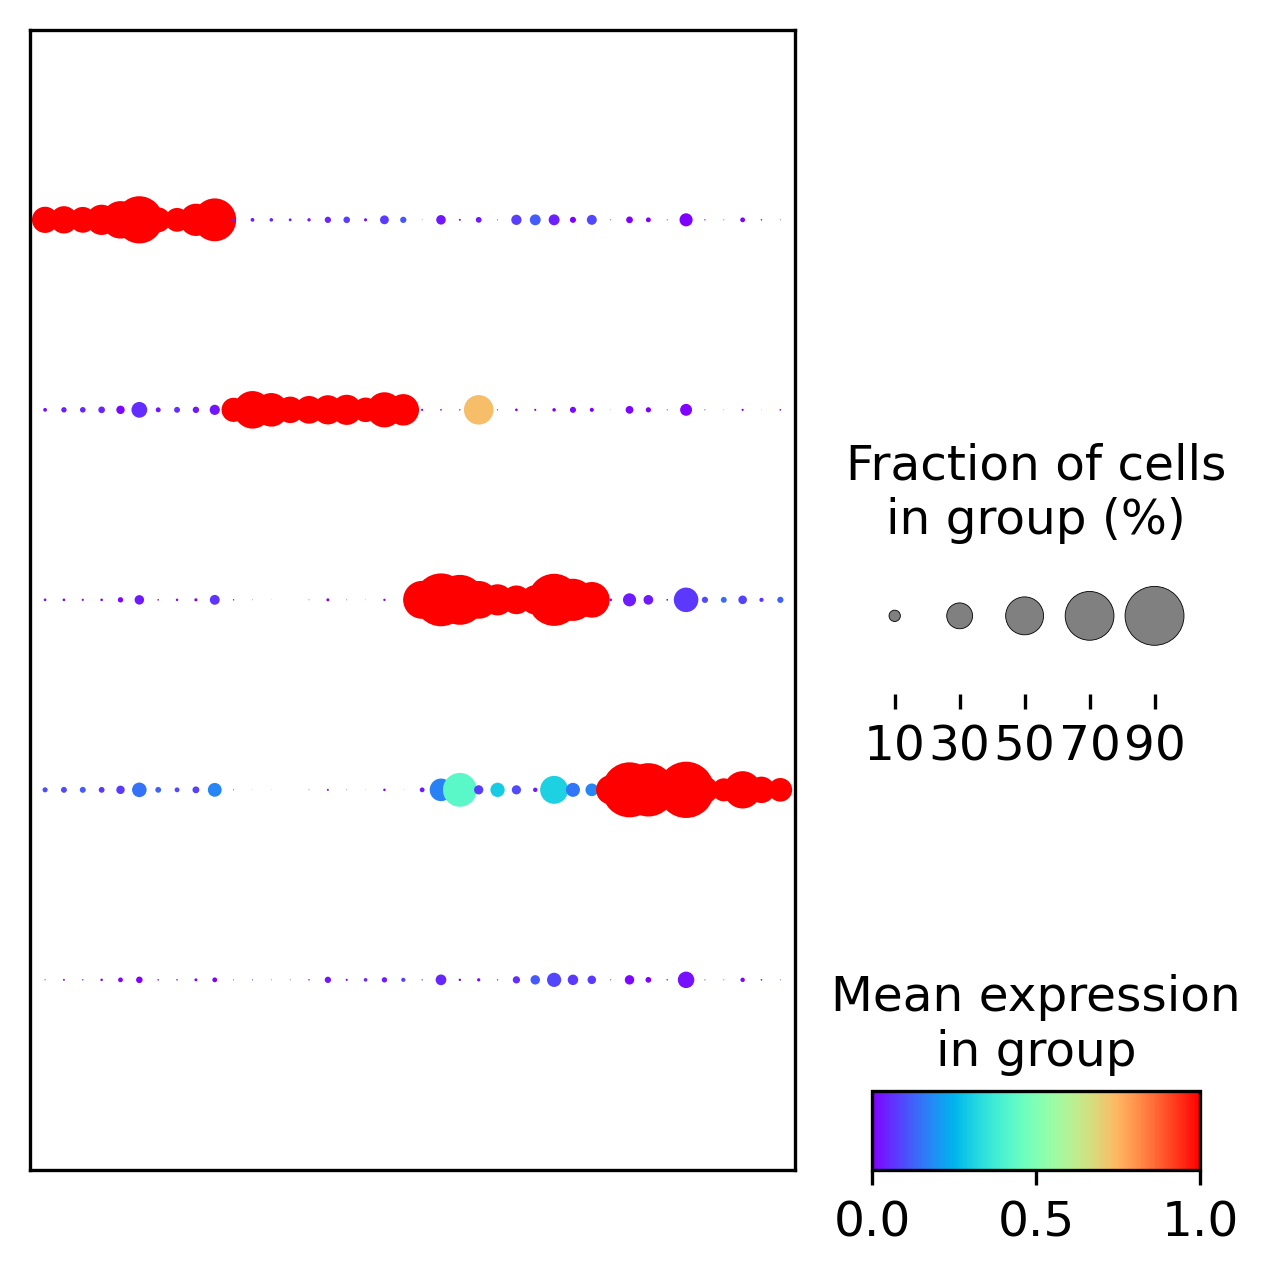
axs = sc.pl.dotplot(adata, var_names=gs1+gs2+gs3+gs4, groupby='branch',cmap='rainbow', standard_scale='var',lw=0, figsize=(5,5),show=False)
axs['mainplot_ax'].tick_params(labelbottom=False,bottom=False,left=False,labelleft=False)
[19]:
exp = adata[:,list(set(gs1+gs2+gs3+gs4))].to_df()
[20]:
scRL.project_expression(gres, exp)
Gene reward training process
[21]:
scRL.gene_rewards(gres, ['1','2','3','4'], gs1)
Reward generating: 100%|██████████████████| 1551/1551 [00:01<00:00, 1467.44it/s]
Time used for reward generation: 1.08 seconds
[23]:
t_gs1 = scRL.trainer('ActorCritic', gres, reward_type='gene', X_latent=X_pca, num_episodes=1e4, gamma=.95)

r, v = t_gs1.train()
Iteration1: 100%|███████████| 1000/1000 [00:10<00:00, 92.25it/s, E=1000, R=5.76]
Iteration2: 100%|███████████| 1000/1000 [00:15<00:00, 63.56it/s, E=2000, R=6.23]
Iteration3: 100%|███████████| 1000/1000 [00:16<00:00, 59.71it/s, E=3000, R=7.06]
Iteration4: 100%|███████████| 1000/1000 [00:16<00:00, 60.80it/s, E=4000, R=7.40]
Iteration5: 100%|███████████| 1000/1000 [00:17<00:00, 58.36it/s, E=5000, R=7.32]
Iteration6: 100%|███████████| 1000/1000 [00:16<00:00, 61.24it/s, E=6000, R=6.76]
Iteration7: 100%|███████████| 1000/1000 [00:17<00:00, 57.78it/s, E=7000, R=7.99]
Iteration8: 100%|███████████| 1000/1000 [00:17<00:00, 57.90it/s, E=8000, R=7.15]
Iteration9: 100%|███████████| 1000/1000 [00:17<00:00, 56.46it/s, E=9000, R=7.56]
Iteration10: 100%|█████████| 1000/1000 [00:17<00:00, 56.46it/s, E=10000, R=7.02]
[24]:
scRL.get_state_value(gres, t_gs1, 'gs1')
scRL.project_back(gres, 'gs1')
[26]:
adata.obs['gs1'] = gres.embedding['gs1']
[27]:
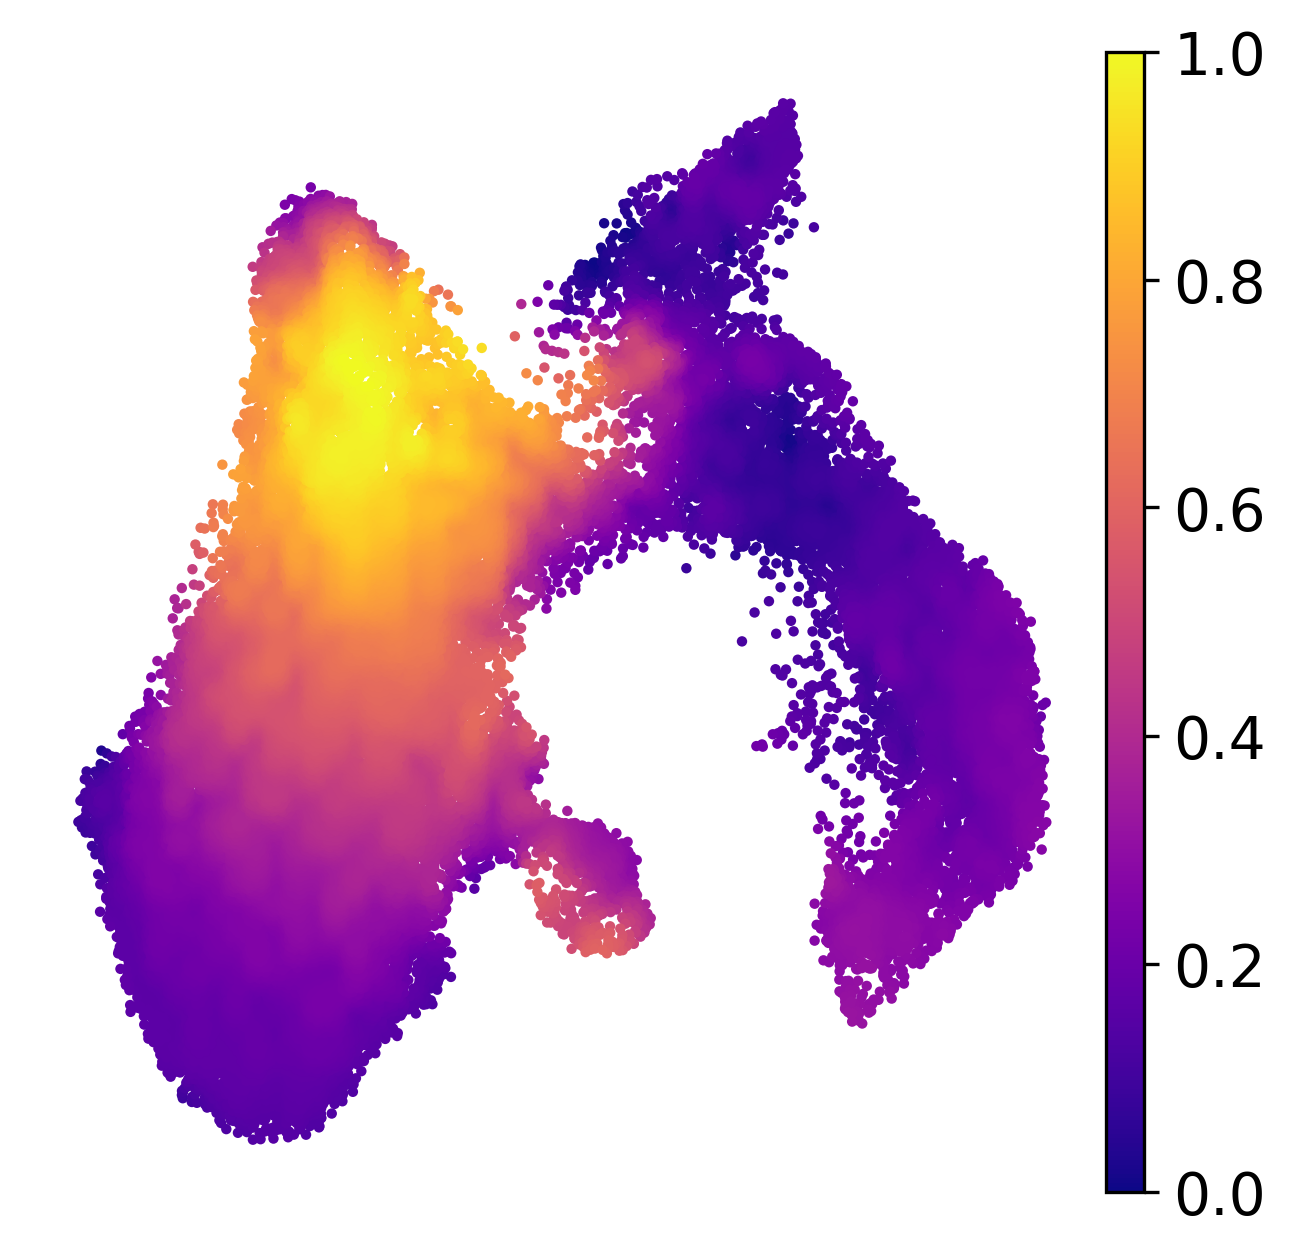
sc.pl.umap(adata, cmap='plasma', color='gs1',s=25,title='',frameon=False,show=False)
[27]:
<AxesSubplot: xlabel='UMAP1', ylabel='UMAP2'>
[28]:
scRL.gene_rewards(gres, ['1','2','3','4'], gs2)
Reward generating: 100%|██████████████████| 1551/1551 [00:00<00:00, 1711.96it/s]
Time used for reward generation: 0.92 seconds
[29]:
t_gs2 = scRL.trainer('ActorCritic', gres, reward_type='gene', X_latent=X_pca, num_episodes=1e4, gamma=.95)

r, v = t_gs2.train()
Iteration1: 100%|██████████| 1000/1000 [00:08<00:00, 114.61it/s, E=1000, R=3.19]
Iteration2: 100%|███████████| 1000/1000 [00:10<00:00, 97.27it/s, E=2000, R=3.27]
Iteration3: 100%|███████████| 1000/1000 [00:10<00:00, 96.29it/s, E=3000, R=5.16]
Iteration4: 100%|███████████| 1000/1000 [00:10<00:00, 97.22it/s, E=4000, R=5.50]
Iteration5: 100%|██████████| 1000/1000 [00:09<00:00, 100.39it/s, E=5000, R=4.46]
Iteration6: 100%|███████████| 1000/1000 [00:10<00:00, 94.39it/s, E=6000, R=5.58]
Iteration7: 100%|███████████| 1000/1000 [00:10<00:00, 91.89it/s, E=7000, R=5.33]
Iteration8: 100%|███████████| 1000/1000 [00:10<00:00, 95.81it/s, E=8000, R=5.85]
Iteration9: 100%|███████████| 1000/1000 [00:10<00:00, 94.77it/s, E=9000, R=5.43]
Iteration10: 100%|█████████| 1000/1000 [00:10<00:00, 93.39it/s, E=10000, R=6.62]
[30]:
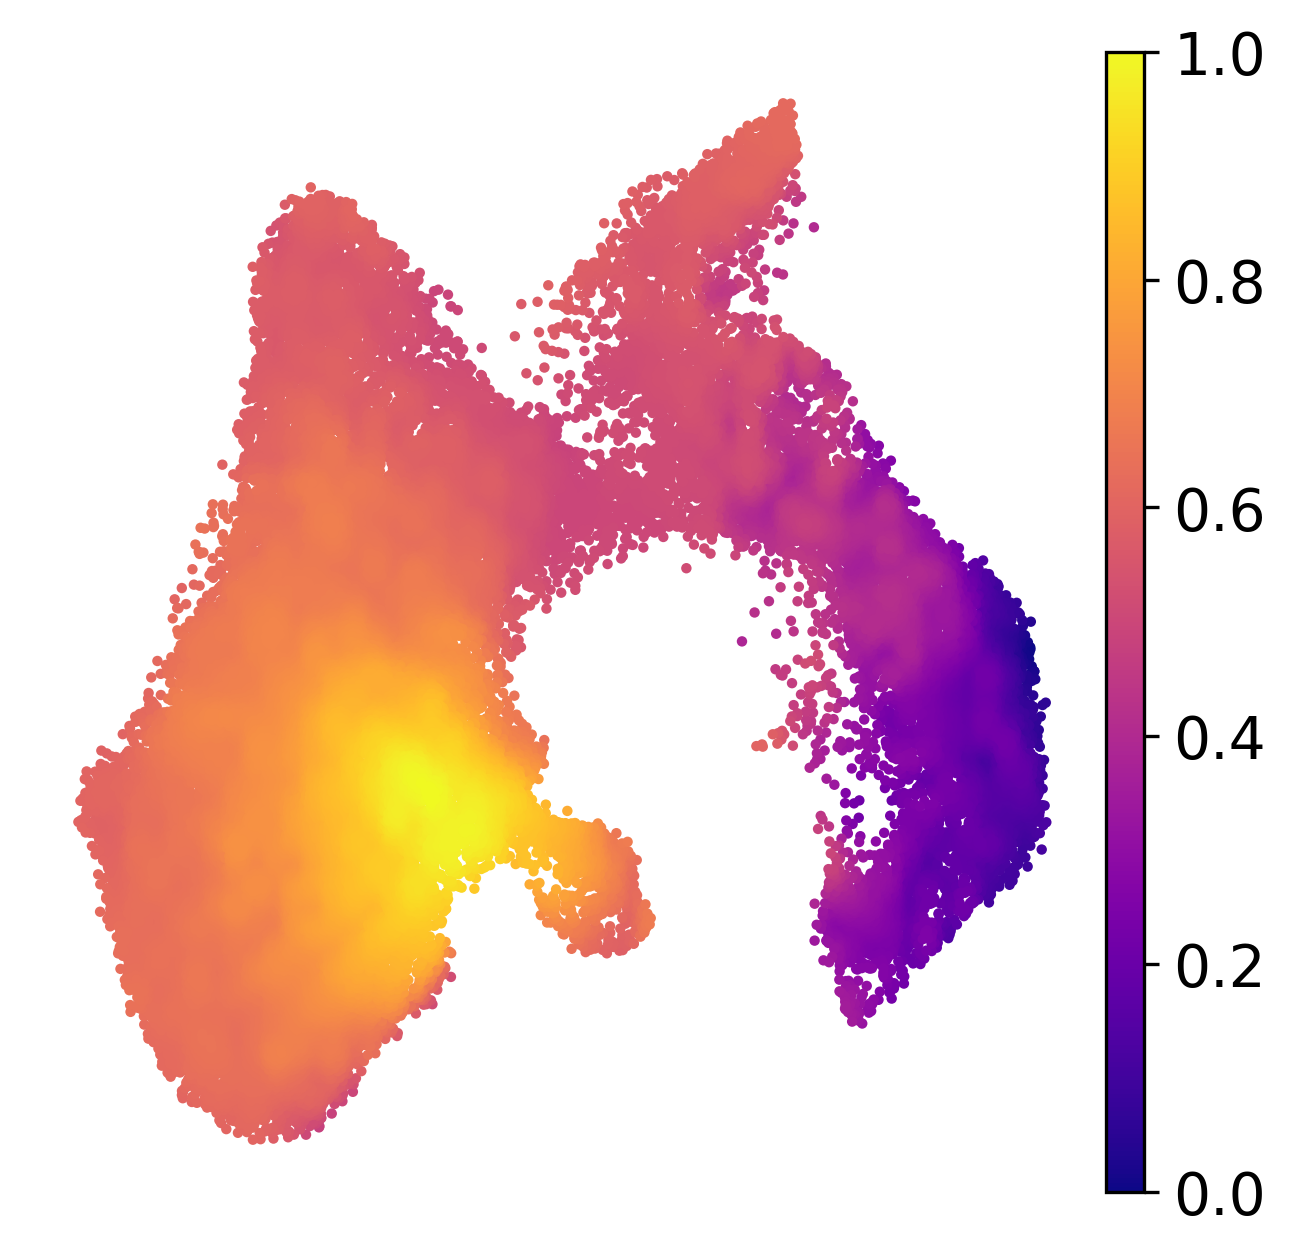
scRL.get_state_value(gres, t_gs2, 'gs2')
scRL.project_back(gres, 'gs2')
[31]:
adata.obs['gs2'] = gres.embedding['gs2']
[32]:
sc.pl.umap(adata, cmap='plasma', color='gs2',s=25,title='',frameon=False,show=False)
[32]:
<AxesSubplot: xlabel='UMAP1', ylabel='UMAP2'>
[33]:
scRL.gene_rewards(gres, ['1','2','3','4'], gs3)
Reward generating: 100%|██████████████████| 1551/1551 [00:01<00:00, 1347.62it/s]
Time used for reward generation: 1.17 seconds
[34]:
t_gs3 = scRL.trainer('ActorCritic', gres, reward_type='gene', X_latent=X_pca, num_episodes=1e4, gamma=.95)

r, v = t_gs3.train()
Iteration1: 100%|██████████| 1000/1000 [00:08<00:00, 112.80it/s, E=1000, R=2.72]
Iteration2: 100%|███████████| 1000/1000 [00:17<00:00, 57.78it/s, E=2000, R=5.29]
Iteration3: 100%|███████████| 1000/1000 [00:19<00:00, 50.82it/s, E=3000, R=7.12]
Iteration4: 100%|███████████| 1000/1000 [00:20<00:00, 48.35it/s, E=4000, R=6.22]
Iteration5: 100%|███████████| 1000/1000 [00:20<00:00, 48.79it/s, E=5000, R=6.72]
Iteration6: 100%|███████████| 1000/1000 [00:20<00:00, 48.83it/s, E=6000, R=6.66]
Iteration7: 100%|███████████| 1000/1000 [00:18<00:00, 53.04it/s, E=7000, R=7.65]
Iteration8: 100%|███████████| 1000/1000 [00:18<00:00, 54.96it/s, E=8000, R=7.09]
Iteration9: 100%|███████████| 1000/1000 [00:18<00:00, 53.48it/s, E=9000, R=6.43]
Iteration10: 100%|█████████| 1000/1000 [00:19<00:00, 52.30it/s, E=10000, R=7.83]
[35]:
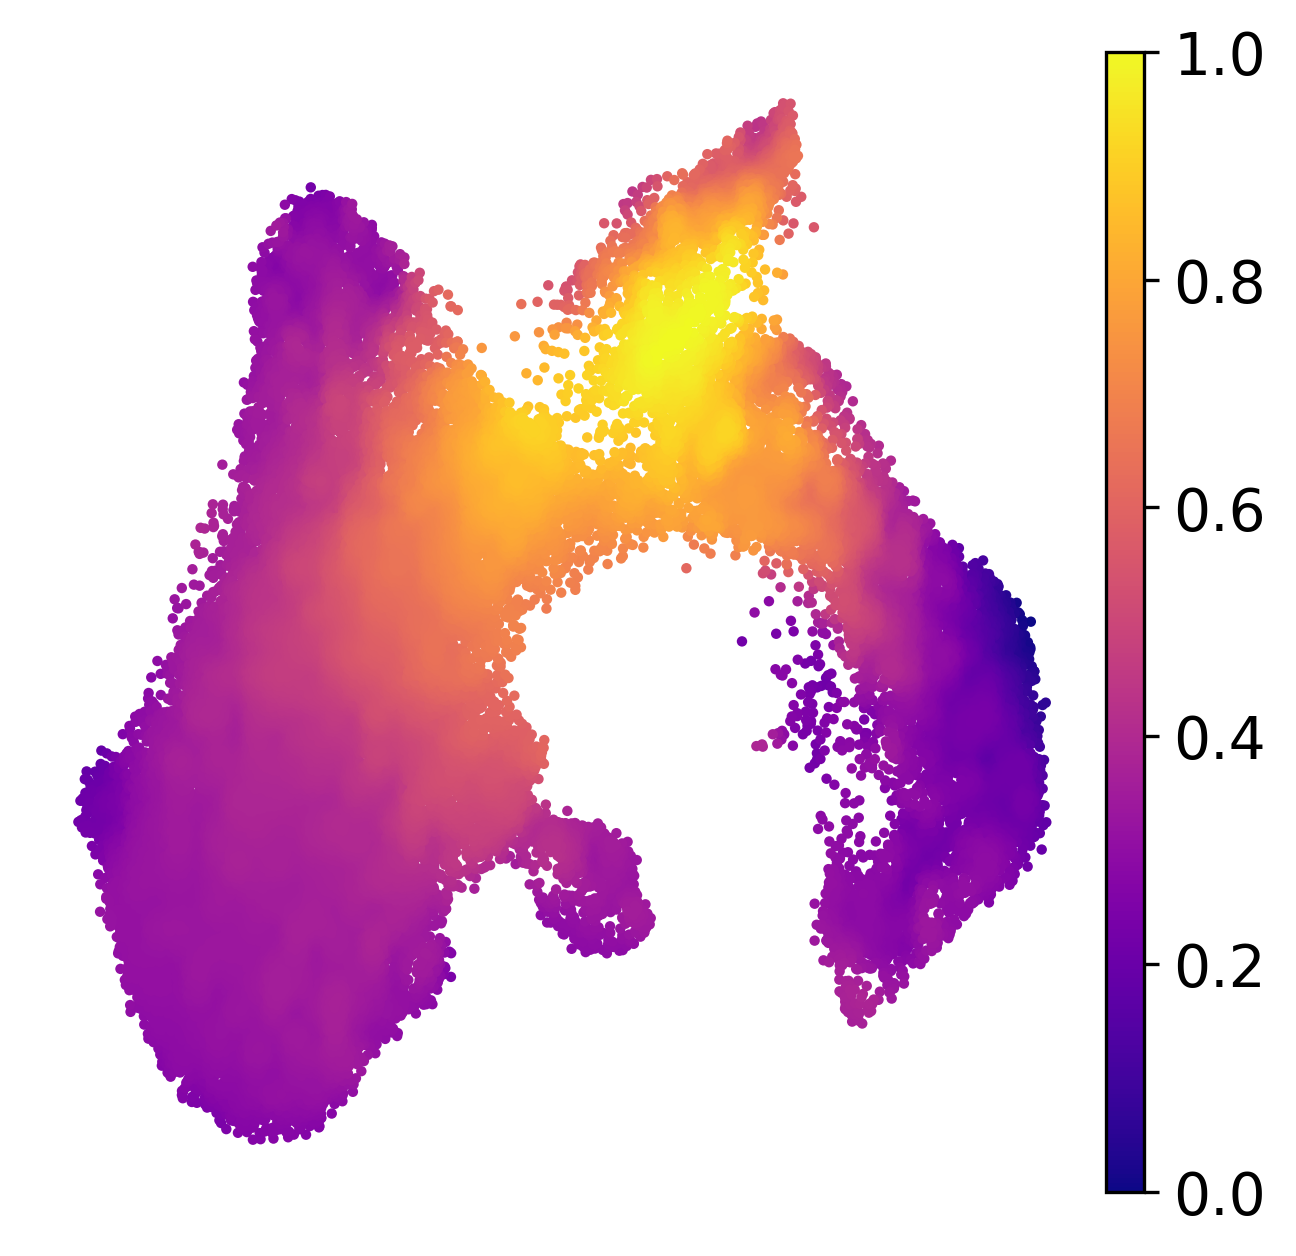
scRL.get_state_value(gres, t_gs3, 'gs3')
scRL.project_back(gres, 'gs3')
[36]:
adata.obs['gs3'] = gres.embedding['gs3']
[37]:
sc.pl.umap(adata, cmap='plasma', color='gs3',s=25,title='',frameon=False,show=False)
[37]:
<AxesSubplot: xlabel='UMAP1', ylabel='UMAP2'>
[38]:
scRL.gene_rewards(gres, ['1','2','3','4'], gs4)
Reward generating: 100%|██████████████████| 1551/1551 [00:01<00:00, 1358.70it/s]
Time used for reward generation: 1.16 seconds
[39]:
t_gs4 = scRL.trainer('ActorCritic', gres, reward_type='gene', X_latent=X_pca, num_episodes=1e4, gamma=.95)

r, v = t_gs4.train()
Iteration1: 100%|███████████| 1000/1000 [00:11<00:00, 85.01it/s, E=1000, R=0.60]
Iteration2: 100%|███████████| 1000/1000 [00:17<00:00, 58.39it/s, E=2000, R=7.93]
Iteration3: 100%|██████████| 1000/1000 [00:20<00:00, 48.31it/s, E=3000, R=10.05]
Iteration4: 100%|██████████| 1000/1000 [00:21<00:00, 46.52it/s, E=4000, R=10.74]
Iteration5: 100%|██████████| 1000/1000 [00:20<00:00, 48.62it/s, E=5000, R=10.17]
Iteration6: 100%|██████████| 1000/1000 [00:21<00:00, 45.93it/s, E=6000, R=12.75]
Iteration7: 100%|██████████| 1000/1000 [00:20<00:00, 47.85it/s, E=7000, R=10.17]
Iteration8: 100%|██████████| 1000/1000 [00:20<00:00, 48.18it/s, E=8000, R=13.13]
Iteration9: 100%|██████████| 1000/1000 [00:21<00:00, 46.70it/s, E=9000, R=12.77]
Iteration10: 100%|████████| 1000/1000 [00:21<00:00, 45.56it/s, E=10000, R=13.51]
[40]:
scRL.get_state_value(gres, t_gs4, 'gs4')
scRL.project_back(gres, 'gs4')
[41]:
adata.obs['gs4'] = gres.embedding['gs4']
[42]:
sc.pl.umap(adata, cmap='plasma', color='gs4',s=25,title='',frameon=False,show=False)
[42]:
<AxesSubplot: xlabel='UMAP1', ylabel='UMAP2'>